[Web Scraping 기초] Seaborn - 스크래핑 결과 시각화하기
1) 기상청 날씨 스크래핑하기
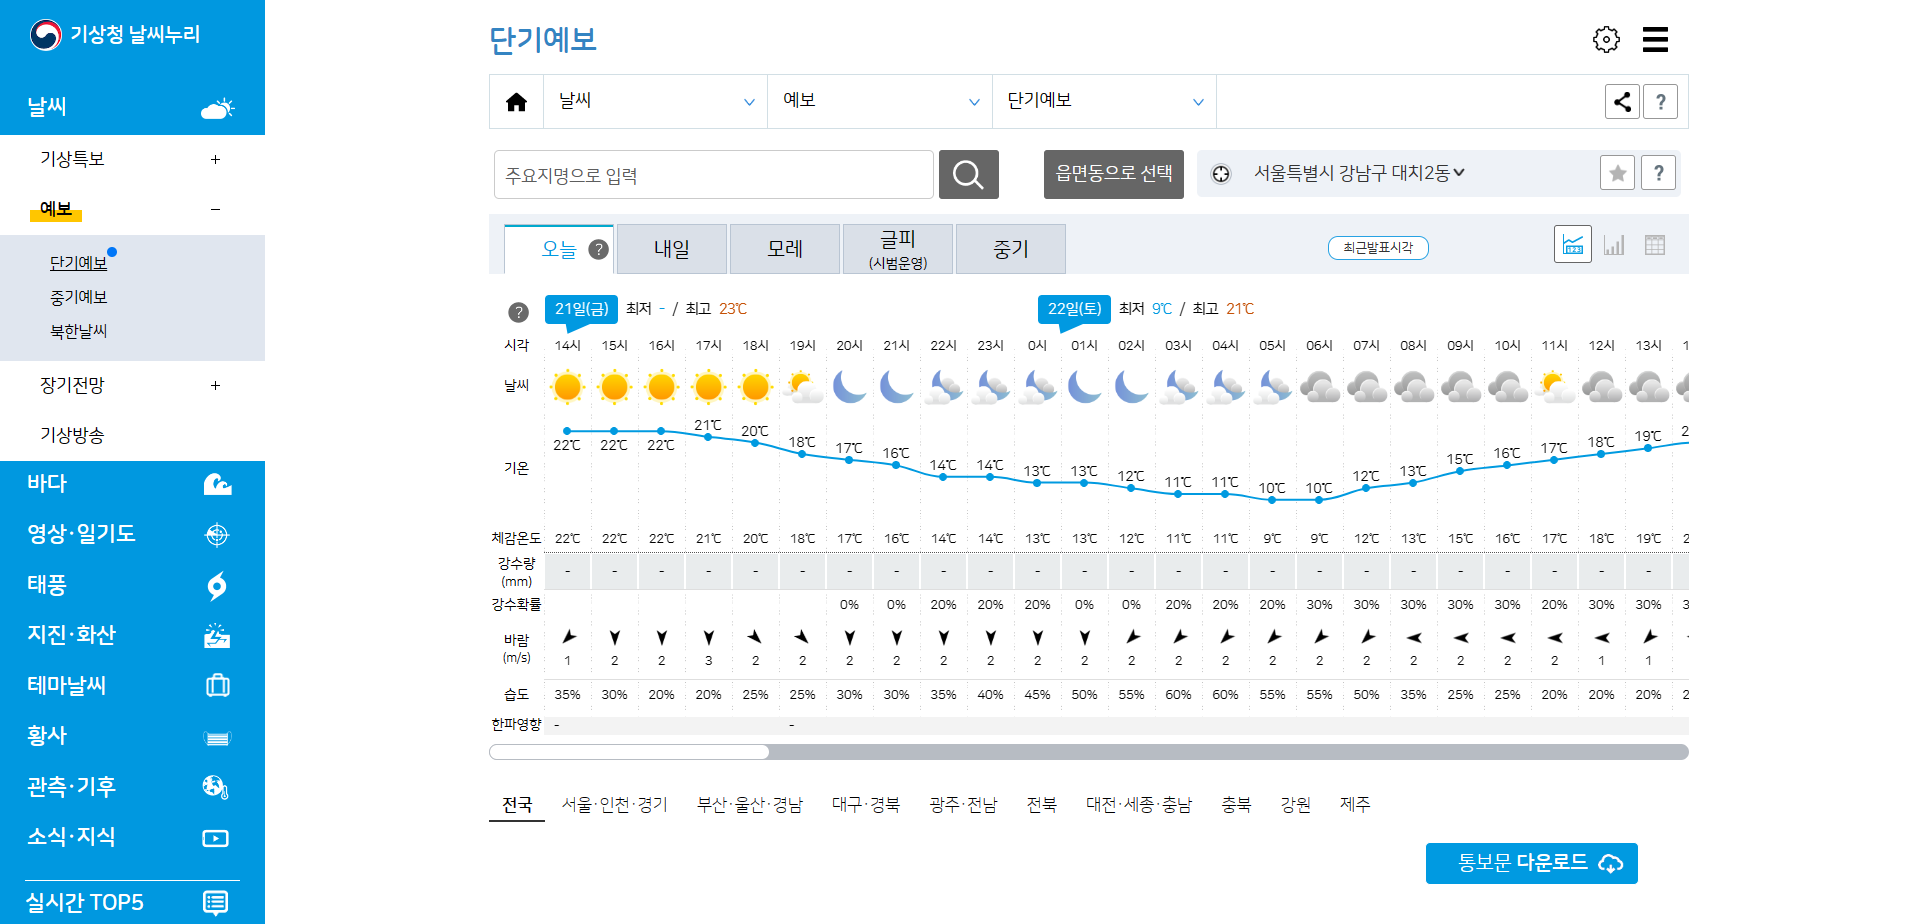
- 기상청 날씨 가운데 있는 온도들을 스크래핑해서 python을 활용해 꺽은선 그래프를 plot 해보자
1. 관련 라이브러리 import
from selenium import webdriver
from webdriver_manager.microsoft import EdgeChromiumDriverManager
from selenium.webdriver.edge.service import Service
from selenium.webdriver.common.by import By
import matplotlib.pyplot as plt
import seaborn as sns
2. 요소 확인
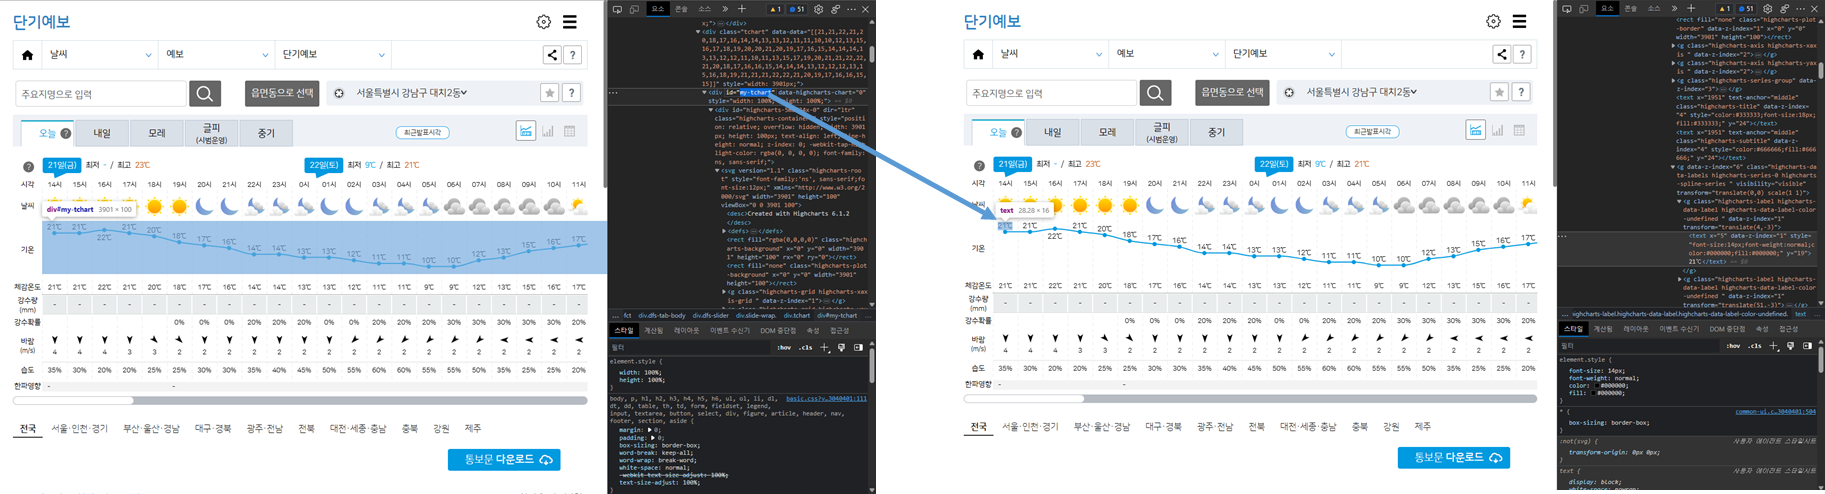
- 스크래핑하고자 하는 온도 데이터는 id = my-tchart인 class 안에 있는 text이다
- 따라서, id = my-tchart인 class 안에 있는 모든 요소들을 찾아 text를 추출하고, 필요없는 요소들은 replace 메소드와
split() 메소드를 활용하기로 한다
3. webdriver를 이용해 기상청 날씨 데이터 가져오기
driver = webdriver.Edge(service=Service(EdgeChromiumDriverManager().install()))

driver.get("https://www.weather.go.kr/w/weather/forecast/short-term.do")
driver.implicitly_wait(3)
temps = driver.find_element(By.ID, "my-tchart").text
temps = [int(t) for t in temps.replace("℃","").split("\n")]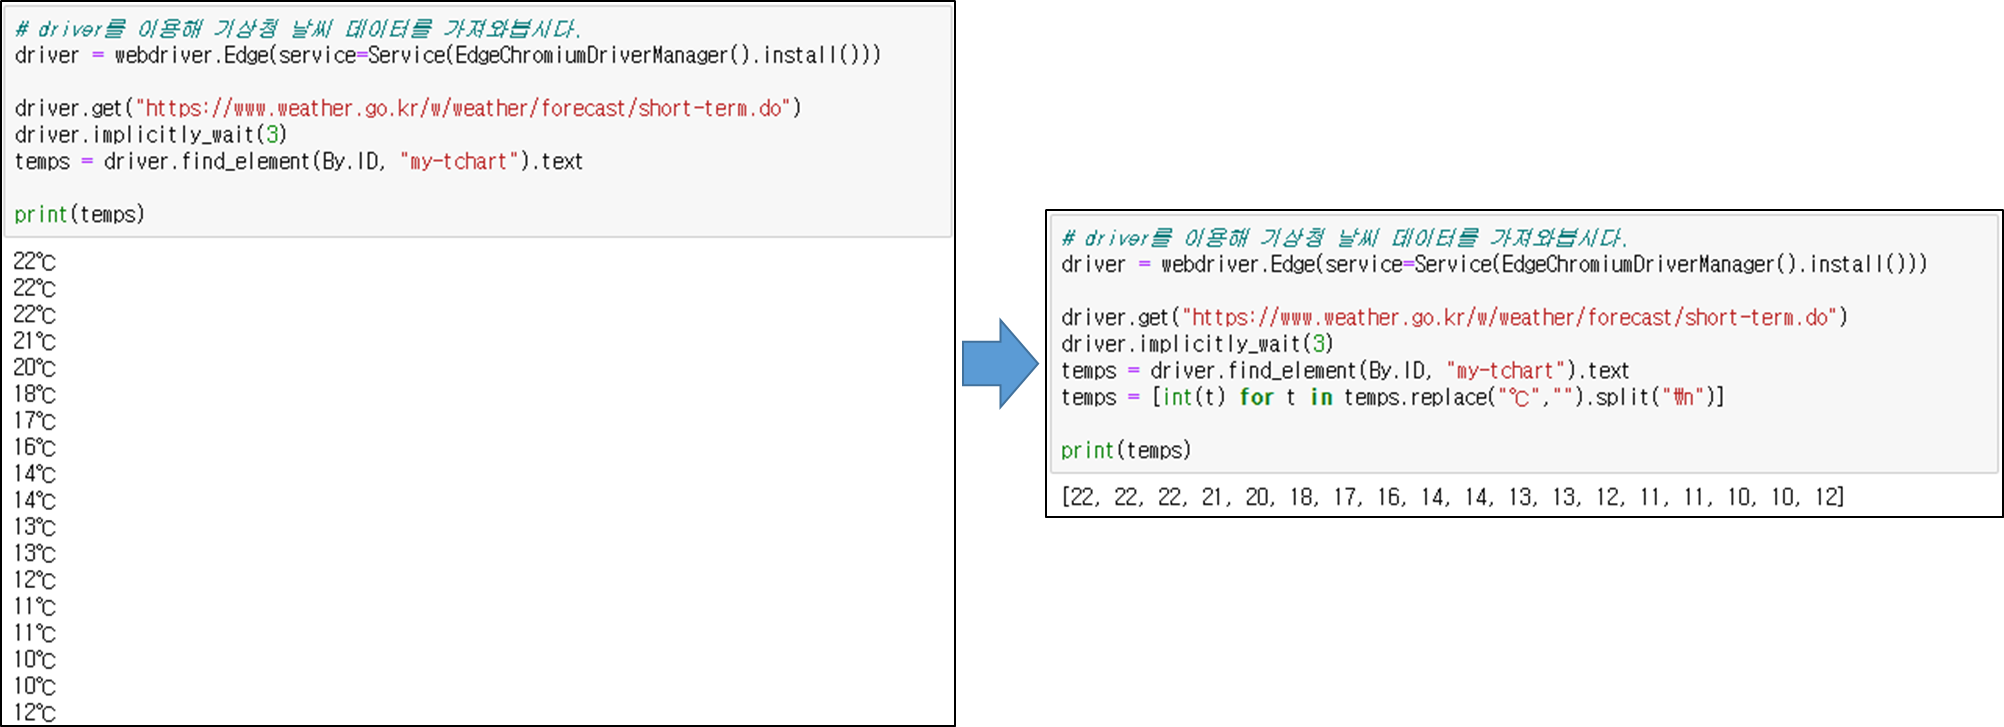
4. Line Plot을 이용해 기온 추이 시각화
import seaborn as sns
# x = Elapsed Time(0~len(temperatures)
# y = temperatures
sns.lineplot(x = [i for i in range(len(temps))], y = temps)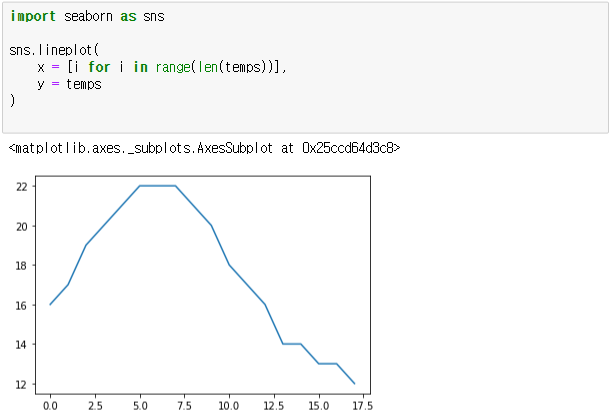
5. Plot 속성 수정
import matplotlib.pyplot as plt

plt.ylim(min(temps) - 2, max(temps) + 2)
plt.title("Expected Temperatur from now on")

sns.lineplot(x = [i for i in range(len(temps))], y = temps)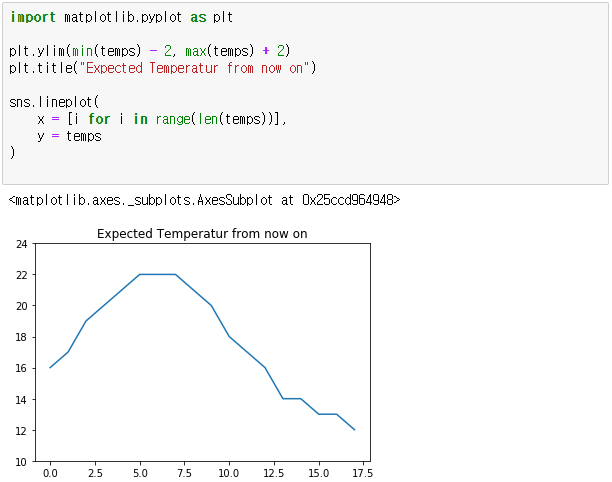
※ 전체 소스
from selenium import webdriver
from webdriver_manager.microsoft import EdgeChromiumDriverManager
from selenium.webdriver.edge.service import Service
from selenium.webdriver.common.by import By
import matplotlib.pyplot as plt
import seaborn as sns
import matplotlib.pyplot as plt

driver = webdriver.Edge(service=Service(EdgeChromiumDriverManager().install()))

driver.get("https://www.weather.go.kr/w/weather/forecast/short-term.do")
driver.implicitly_wait(3)
temps = driver.find_element(By.ID, "my-tchart").text
temps = [int(t) for t in temps.replace("℃","").split("\n")]

import seaborn as sns
# x = Elapsed Time(0~len(temperatures)
# y = temperatures
sns.lineplot(x = [i for i in range(len(temps))], y = temps)

plt.ylim(min(temps) - 2, max(temps) + 2)
plt.title("Expected Temperatur from now on")

sns.lineplot(x = [i for i in range(len(temps))], y = temps)

plt.show()
2) hashcode.com 질문태그 빈도 시각화
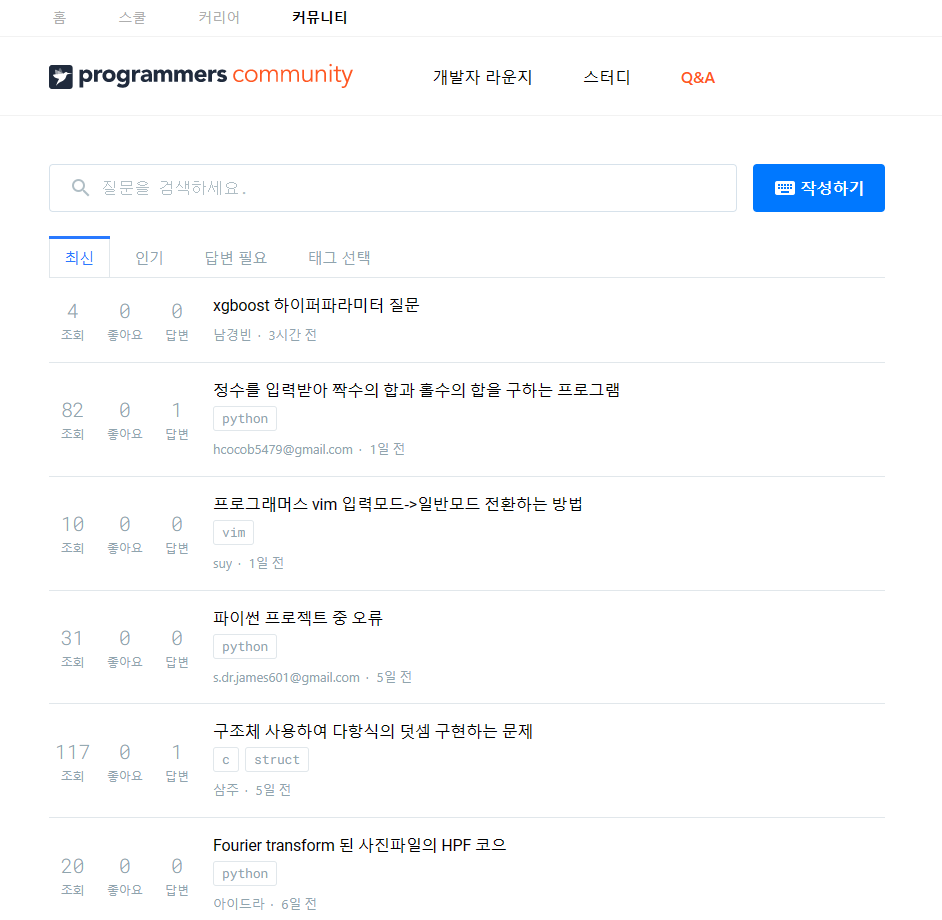
- hashcode.com에 보이는 질문 관련 태그들을 스크래핑하고, 빈도수 상위 10개 태그들을 바 그래프에 plot 해보자
1. 관련 라이브러리 import
import requests
import time
from bs4 import BeautifulSoup
from collections import Counter
import seaborn as sns
import matplotlib.pyplot as plt
2. 질문의 빈도를 체크할 수 있는 dict 생성
frequency = {}3. 요소 확인
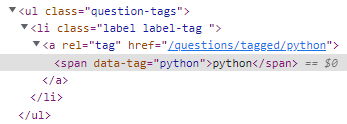
- 추출하고자 하는 요소는 class = question 인 ul 태그 안에 있는 li 태그 내 콘텐츠이다
- 따라서, class = question 인 모든 ul 태그를 찾고, 찾은 ul 태그에서 모든 li태그를 찾은 후 text를 추출한다
- ul 태그 안에 모든 li 태그를 찾는 이유는 한 게시글에 복수개의 태그를 스크래핑하기 위해서이다
4. 1 ~ 10 페이지 까지 태그 text 추출
user_agent = {
    "User-Agent": "Mozilla/5.0 (Macintosh; Intel Mac OS X 10_15_4) AppleWebKit/537.36 (KHTML, like Gecko) Chrome/83.0.4103.97 Safari/537.36"}

for i in range(1, 11) :         # pagination
# 응답을 바탕으로 BeautifulSoup 객체를 생성
    res = requests.get("https://hashcode.co.kr/?page={}".format(i), user_agent)
    soup = BeautifulSoup(res.text, "html.parser")

    # 1 : ul 태그 모두 찾기
    # 2 : 1번 안에 있는 li 태그의 text 추출

    ul_tags = soup.find_all("ul", "question-tags")
    for ul in ul_tags :
        li_tags = ul.find_all("li")
        for li in li_tags :
            tag = li.text.strip()
            if tag not in frequency :
                frequency[tag] = 1
            else :
                frequency[tag] += 1
    time.sleep(0.5)
5. counter를 사용해 가장 빈도가 높은 value 추출
- Counter 메소드를 사용하기 위해서 collections으로부터 Counter를 import해주면 된다
- collections는 따로 설치가 필요없다
counter = Counter(frequency)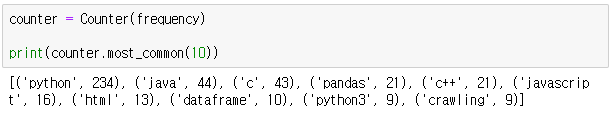
6. bar 그래프 plot
x = [elem[0] for elem in counter.most_common(10)]
y = [elem[1] for elem in counter.most_common(10)]
plt.figure(figsize=(20, 10))
plt.title("Frequency of question in Hashcode")
plt.xlabel("Tag")
plt.ylabel("Frequency")

sns.barplot(x = x, y = y)
plt.show()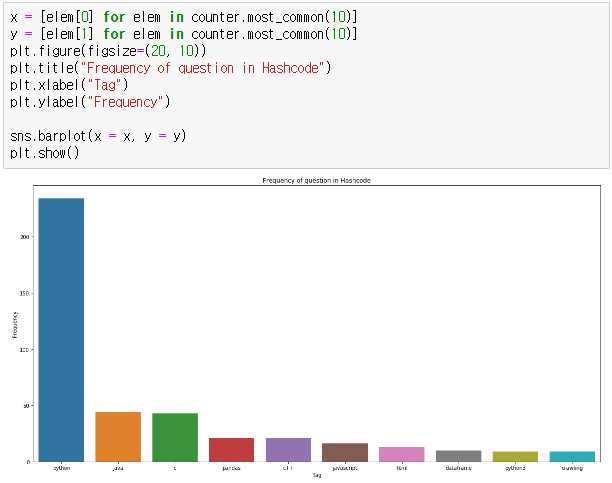
※ 전체 소스
import requests
import time
from bs4 import BeautifulSoup
from collections import Counter
import seaborn as sns
import matplotlib.pyplot as plt
frequency = {}
user_agent = {
    "User-Agent": "Mozilla/5.0 (Macintosh; Intel Mac OS X 10_15_4) AppleWebKit/537.36 (KHTML, like Gecko) Chrome/83.0.4103.97 Safari/537.36"}

for i in range(1, 11) :         # pagination
    res = requests.get("https://hashcode.co.kr/?page={}".format(i), user_agent)
    soup = BeautifulSoup(res.text, "html.parser")

    # 1 : ul 태그 모두 찾기
    # 2 : 1번 안에 있는 li 태그의 text 추출

    ul_tags = soup.find_all("ul", "question-tags")
    for ul in ul_tags :
        li_tags = ul.find_all("li")
        for li in li_tags :
            tag = li.text.strip()
            if tag not in frequency :
                frequency[tag] = 1
            else :
                frequency[tag] += 1
    time.sleep(0.5)

print(frequency)

# 시각화
counter = Counter(frequency)

print(counter.most_common(10))

x = [elem[0] for elem in counter.most_common(10)]
y = [elem[1] for elem in counter.most_common(10)]

plt.figure(figsize=(20, 10))
plt.title("Frequency of question in Hashcode")
plt.xlabel("Tag")
plt.ylabel("Frequency")

sns.barplot(x = x, y = y)
plt.show()